
Red Team findings are very different from penetration testing findings. They are usually much broader and more obviously applicable to either the whole or a large part of your organisation; where a build review of a server detects problems on that server and makes recommendations about the configuration, the results of a Red Team test are often applicable to broad underlying systems, architectural decisions and a business’s processes and people. While this may be daunting initially, it can lead to large uplifts in an organisation's ability to defend its self from attackers once all the learnings are taken on board and remedial advice implemented.
Key to this is the wider scope of the Red Team, not just from a technology side, but also from the people and processes perspective. Obtaining real data on what a simulated attacker was doing on a network when the Security Operations Centre were unable to track them is invaluable in helping mature the team and technologies in the SOC. Across all the findings that are seen in our Red Team engagements the same theme runs of being able to turn risk statements, what ifs and simulations into concrete examples that can be leveraged to understand and address problems.
Analysing findings – the inputs
Context have been performing Red Team engagements for almost as many years as we have existed (so since 1998), but in this time there has been a significant maturation in the whole industry’s approach. In particular, the formulation of the CREST STAR methodology and then the Bank of England’s formalisation of this into CBEST over the last 6 years has helped produce a consistent set of results from what would now be termed ‘a Red Team test’.
For the purposes of this blog we are using data gathered in this time frame from the many engagements Context have performed. Not all use the end to end methodology, but all conform to at least the core section of our methodology as detailed in the white paper. Geographically, we have inputs from New Zealand, Australia and Asia, the US and around Europe, and representation from finance, retail, regulators, healthcare, Governments, media organisations and others.
From these engagements we have analysed the findings to identify key ‘pivot points’ in the simulated attacker’s interaction with the target. These are the enabling weaknesses that turned the attack from an annoying intrusion to a potential disaster for the customer.
The findings
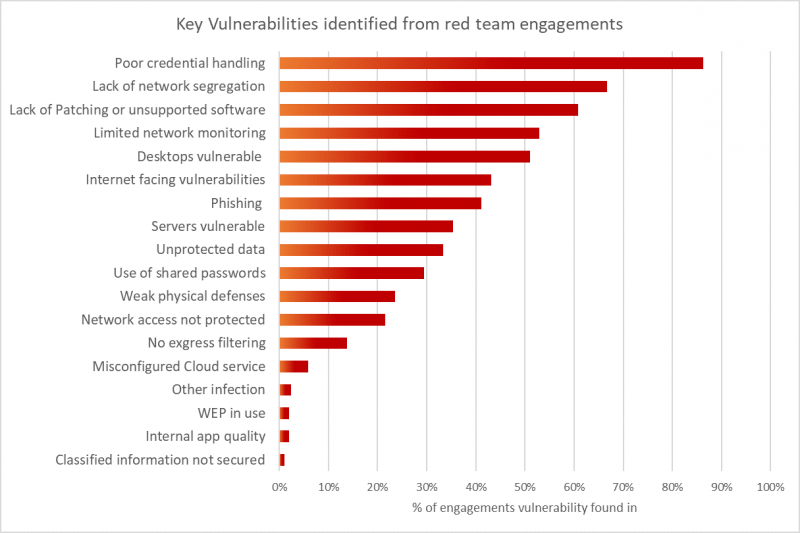
No messing around, let’s get straight into a summary graph:

There are some big problems up at the top of the graph, but we’d like to spend just a few moments at the other end of the scale to highlight some of the more unusual problems we have found on engagements. I’m not going to say anything about the first finding other than to highlight that if you are handling protectively marked documents, please make sure they are afforded all the protections that they should be.
On a positive note, it is rare for the quality of internal applications to come in to play on a Red team. Our second least common finding, however, shows that this does occasionally lead to an attacker getting further into a network than they would otherwise be able to. In these occasional cases we find clusters of applications on a network which exhibit OWASP-Top10 type vulnerabilities, usually many at a time. This makes identifying additional credentials or obtaining sensitive target data early in the engagement much easier.
So remember, just because it's internal doesn’t mean that no attention to security should be paid at all!
The next one on the list is the use of WEP, on an internally connected Wi-Fi network. This makes it really convenient for our consultants to get onto the network with their full toolset from out in the carpark (or similar). Most people have moved away from WEP thankfully, and for preference are fully isolating their Wi-Fi provisions from the internal network, but we have seen poor Wi-Fi implementations on occasion.
The final one of these rarer occurrences that we would like to call out is when we find the occasional evidence of an active intrusion already running. This usually promotes our Red Team activity to a response engagement and it’s great to be able to help our customers in this situation.
Sitting surprisingly in the middle of the chart is Phishing. Most people we talk to assume that this would be right up at the top of the chart as the most common compromise vector. A number of different reasons means that this isn’t true in our dataset. Firstly, we are counting the pivot points, where a breach goes from annoying to threatening, and on its own a phishing attack is rarely that key moment in an attack. Secondly, making this assumption many clients ask us to skip this part of the test and conduct what we call an ‘assumed compromise’ assessment. It’s a fair assumption that a dedicated attacker targeting your organisation will eventually get onto the network so skipping this part of the test can be a fair cost saving option to allow the organisation to concentrate on assessing their detection & response capabilities and finding out what an attacker might do once inside the network.
In our next post we will look in more detail at the other end of the chart, the top common problems.