
You may remember from a previous blog post, that I like working with Windows memory - it really is amazing what can be found when you dedicate some time to it. It's also amazing what can be found by accident when you're meant to be finding something else.
In support of the Volatility Foundation's Volatility Framework, I wanted to write a plugin to enter into the Volatility Plugin Contest 2015. The idea that I came up with was to retrieve the DNS cache from a Windows memory sample. The DNS cache is used by Windows to, well, cache DNS. When Windows retrieves a DNS record, it lives in the cache either until the TTL expires or there's some kind of networking change (or the MaxCacheTtl or MaxCacheEntryTtlLimit is reached, or this, or that, or the other... you get the idea: there's a cache, it doesn't persist forever).
You can view the current state of the cache with the `ipconfig` command:
C:\>ipconfig /displaydns

Windows IP Configuration

    somehost.contextis.co.uk
    ----------------------------------------
    Record Name . . . . . : somehost.contextis.co.uk
    Record Type . . . . . : 1
    Time To Live  . . . . : 2218
    Data Length . . . . . : 4
    Section . . . . . . . : Answer
    A (Host) Record . . . : 10.1.1.1

    anotherhost.contextis.co.uk
    ----------------------------------------
    Record Name . . . . . : anotherhost.contextis.co.uk
    Record Type . . . . . : 1
    Time To Live  . . . . : 2707
    Data Length . . . . . : 4
    Section . . . . . . . : Answer
    A (Host) Record . . . : 10.1.1.2
Knowing Where to Look
Probably the biggest challenge of working with memory is understanding the data structure that contains the data you're interested in. The second biggest challenge is finding the data in the first place. So, a bit of research is needed to know where to look for the DNS cache.
The DNS cache is maintained by the DNS Service. Specifically, the dnsrslvr.dll (read: 'DNS resolver'), typically located at `C:\Windows\System32\dnsrslvr.dll`.

So, this was looking pretty straightforward. Volatility already has the ability to locate the process memory of a particular service (via the svcscan plugin), so it should just be a matter of searching that process memory for my host names and kind of seeing whether there's a reliable way of extracting them.
Initial Testing
In the Windows VM, it's straightforward enough to generate some DNS cache entries:
C:\>ping google.com

Pinging google.com [216.58.208.46] with 32 bytes of data:
Reply from 216.58.208.46: bytes=32 time=8ms TTL=128
Reply from 216.58.208.46: bytes=32 time=8ms TTL=128
Reply from 216.58.208.46: bytes=32 time=8ms TTL=128
Reply from 216.58.208.46: bytes=32 time=8ms TTL=128

Ping statistics for 216.58.208.46:
    Packets: Sent = 4, Received = 4, Lost = 0 (0% loss),
Approximate round trip times in milli-seconds:
    Minimum = 8ms, Maximum = 8ms, Average = 8ms

C:\>ping gmail.com

Pinging gmail.com [216.58.208.37] with 32 bytes of data:
Reply from 216.58.208.37: bytes=32 time=8ms TTL=128
Reply from 216.58.208.37: bytes=32 time=8ms TTL=128
Reply from 216.58.208.37: bytes=32 time=8ms TTL=128
Reply from 216.58.208.37: bytes=32 time=9ms TTL=128

Ping statistics for 216.58.208.37:
    Packets: Sent = 4, Received = 4, Lost = 0 (0% loss),
Approximate round trip times in milli-seconds:
    Minimum = 8ms, Maximum = 9ms, Average = 8ms
Working in a VM makes it easy to analyse the memory: we can simply pause/suspend the VM and, in the case of VMware Workstation, the vmem file contains the guest's memory.
Locate the Process, Dump the Process Memory
Being a service, the binary (the dll) runs within an svchost process, of which there are many on any Windows system, so we need to know which particular svchost we're interested in:
> python vol.py -f windows.vmem --profile Win7SP1x64 svcscan
--SNIP--
Offset: 0x2e7890
Order: 74
Start: SERVICE_AUTO_START
Process ID: 720
Service Name: DNScache
Display Name: DNS Client
Service Type: SERVICE_WIN32_SHARE_PROCESS
Service State: SERVICE_RUNNING
Binary Path: C:\Windows\system32\svchost.exe -k NetworkService
--SNIP--
So, process with process ID (PID) 720 it is. And dump the memory with the memdump plugin:
> python vol.py -f windows.vmem --profile Win7SP1x64 memdump --pid 720 --dump-dir .
Volatility Foundation Volatility Framework 2.5
************************************************************************
Writing svchost.exe [   720] to 720.dmp
With the memory dumped, we can open it in a hex editor and search for the host names:

Missed Clue #1: Where in memory are we?
My first mistake was to blindly follow my hypothesis. My thought process was that I was finding the hits in the process memory, but I was suffering some serious confirmation bias. I should've checked specifically where these hits were. I could've done this with the memmap plugin:
> python vol.py -f windows.vmem --profile Win7SP1x64 memmap --pid 720 --output-file 720-memmap.txt
Virtual            Physical                         Size     DumpFileOffset
------------------ ------------------ ------------------ ------------------
--SNIP--
0x0000fa8002800000 0x000000007ee00000           0x200000          0xdf67000
0x0000fa8002a00000 0x000000007ec00000           0x200000          0xe167000
0x0000fa8002c00000 0x000000007ea00000           0x200000          0xe367000
0x0000fa8002e00000 0x000000007e800000           0x200000          0xe567000 <--
0x0000fa8003000000 0x000000007e600000           0x200000          0xe767000
0x0000fa8003200000 0x000000007e400000           0x200000          0xe967000
0x0000fa8003400000 0x000000007e200000           0x200000          0xeb67000
0x0000fa8003600000 0x000000007e000000           0x200000          0xed67000
0x0000fa8003800000 0x000000007de00000           0x200000          0xef67000
0x0000fa8003a00000 0x000000007dc00000           0x200000          0xf167000
--SNIP--
What we're seeing here is map of virtual memory, to physical location in the raw memory dump, to location in the process memory dump. The range indicated by the arrow shows there is a run of 0x200000 bytes starting at 0xe567000 in the process dump file which represents a range of 0x200000 bytes in virtual memory starting at 0x0000fa8002e00000.
You may know that in 64-bit Windows, the virtual address space is divided up as follows:
0x00000000'00000000 --> 0x000007FF'FFFFFFFF - User Space
0xFFFF0800'00000000 --> 0xFFFFFFFF'FFFFFFFF - System (Kernel) Space
With that in mind, where does 0x0000fa80'02e00000 fit? Seemingly in the no man's land between the two ranges. Actually, that's not true. In 64-bit architecture, memory addresses only use 48-bits, so the top 16 bits (2 bytes) are just extensions of the most-significant bit (MSB). In our example that's 'f', so the address is technically 0xfffffa80'02e00000 - which is in the System Space.
Yes. In the system (kernel) space. Not in the user space as we would expect if the memory truly belonged to a process. More on this later.
Back to the hex...
Highlighted in the hex above, the four bytes `NDsh` can be seen. From experience, this looks a little bit like a pool tag. So a bit of searching found a reference to `NDsh`:
NDsh - ndis.sys - NDIS_TAG_SHARED_MEMORY
This made me happy: I had a pool tag I could search for, I could then read off the host names. Job done. But I shouldn't have been, and it wasn't.
(To be clear, `NDsh` doesn't appear to technically be a pool tag. MHL told me that "!poolfind NDsh in windbg doesn't find any results, nor do any other fields in _POOL_HEADER if you run volshell's dt command on addresses being found.")
Missed Clue #2: A .SYS FILE!!!
For whatever reason, which is somewhat embarrassing now, I didn't pay attention to the `ndis.sys` bit. This is of course a kernel-level driver and the implementation of the Network Driver Interface Specification (NDIS). If I had paid attention, I would've taken a shortcut straight to the conclusion that I did eventually get to.
Writing a plugin
Writing a Volatility plugin for what I thought I knew was pretty straightforward: I located the service which identified the process, I searched the process memory for `NDsh` and essentially parsed the strings that followed. The output looked something like this:
> python vol.py --plugins=dnscache -f windows.vmem --profile Win7SP1x64 dnscache
==============================
DNS Client: svchost.exe (1168)
==============================
memtest-PC
ENEFENFEEFFDFECNFAEDCACACACACAAA (MEMTEST-PC    )
FHEPFCELEHFCEPFFFACACACACACACAAA (WORKGROUP     )
s0.2mdn.net
ENEFENFEEFFDFECNFAEDCACACACACAAA (MEMTEST-PC    )
ENEFENFEEFFDFECNFAEDCACACACACAAA (MEMTEST-PC    )
FHEPFCELEHFCEPFFFACACACACACACAAA (WORKGROUP     )
log.dmtry.com
dps.bing.com
memtest-PC
ENEFENFEEFFDFECNFAEDCACACACACAAA (MEMTEST-PC    )
FHEPFCELEHFCEPFFFACACACACACACAAA (WORKGROUP     )
ENEFENFEEFFDFECNFAEDCACACACACAAA (MEMTEST-PC    )
ENEFENFEEFFDFECNFAEDCACACACACAAA (MEMTEST-PC    )
FHEPFCELEHFCEPFFFACACACACACACAAA (WORKGROUP     )
isatap
dns.msftncsi.com
dns.msftncsi.com
wpad
connect.facebook.com
platform.twitter.com
www.msn.com
ocsp.digicert.com
--SNIP--
Not bad. (And in case you're wondering, the long names in capitals are encoded NetBIOS names.) This looks like plausible output: there's definitely some Internet host names there. But there's also NetBIOS names. Why are there NetBIOS names in a DNS cache?
Not only did I need to address the NetBIOS peculiarity, I was also feeling unhappy with the work: I was essentially running strings across a process memory dump.
Back to the Source Data
Feeling unhappy, I returned to the source data. I adapted my plugin to dump a run of bytes from `NDsh` onward to see what it looked like:

OK. There's clearly a pattern here. And if you look carefully, there also seems to be some kind of slack going on. There are fragments of host names that appear to have had the first part overwritten. Trying to figure out the pattern I wondered if viewing the data as hex bytes would help. Take a look, see if you can spot what I couldn't:

I couldn't spot the pattern because I'm not enough of a networking nerd. Luckily, I know one. Steve, (he of RDP Replay fame), was taking a passing interest and asked to see the raw data. It took Steve no time at all, as in, a matter of seconds, to declare, "That's an IP packet."
Packets FTW.
It was at this point that everything crumbled and was immediately rebuilt on vastly sturdier foundations. Going back through my notes I saw NDIS, I saw SYS file... I saw kernel memory. I found the host names in "process memory" because all processes have access to the shared kernel memory. I would've found the host names in ANY process memory. A bit more research and I realised I was staring at the incoming and outgoing buffers of ndis.sys, basically, the area of kernel memory where the packets are stored as they are dispatched to, or received from, the NIC.
This was fun! If I had packets, I could write a PCAP file. Taking a memory sample and generating a PCAP of the packets in the NDIS buffers? That's cool. I rewrote the plugin, parsing some data from the packets directly to the output, and adding an option to save the packets to a pcap file:

XP, Vista, 7, and 10
The Wikipedia page for NDIS tells us that there has been a version of ndis.sys in every version of Windows from 3.1 through to and including 10/Server 2016. So, my plugin should work for all the currently commonly used versions. It didn't.
I was still using the `NDsh` bytes as my marker to search for. Not all versions of ndis.sys include this marker. I needed something else, something more reliable. If you know Ethernet packets (like I now do!), you'll know that the first 6 bytes are the destination MAC address and the second 6 bytes are the source MAC address. The source MAC address is vastly better for two reasons:
We can easily find it out. It's the MAC address from the NIC of the machine from which we took the memory sample.
It's 6 bytes, rather than, 4, which is statistically much less likely to occur as a false positive than the 4-byte `NDsh`. (Plus we add all kinds of checks for expected values such as Ethertype.)
The plugin was updated again. You can provide a MAC address as a command line switch, or if you don't, the plugin will try and detect it by finding the `NDsh` marker.
Carving vs Parsing
It is of course true that, fundamentally, the plugin is simply carving from kernel memory. I don't really see a problem with that. It works. We know why it works and I've actually never seen a false positive.
That said, if you examine the PDB file for `ndis.sys`, you'll see some constants. In the case of an ndis.sys taken from Windows 7 64-bit, some constants such as:
ndisRecvPacketPool 418152
ndisSendPacketPool 418144
ndisFreePacketPool 47696
and some others.
It would arguably be more elegant to see if these constants are indeed offsets to the buffers we're carving. It might provide a way of getting to the buffers if there's no `NDsh` marker, or if the MAC address is unknown, or as a way of confirming the MAC address.
Columbo: "Just one more thing."
Remember the slack?

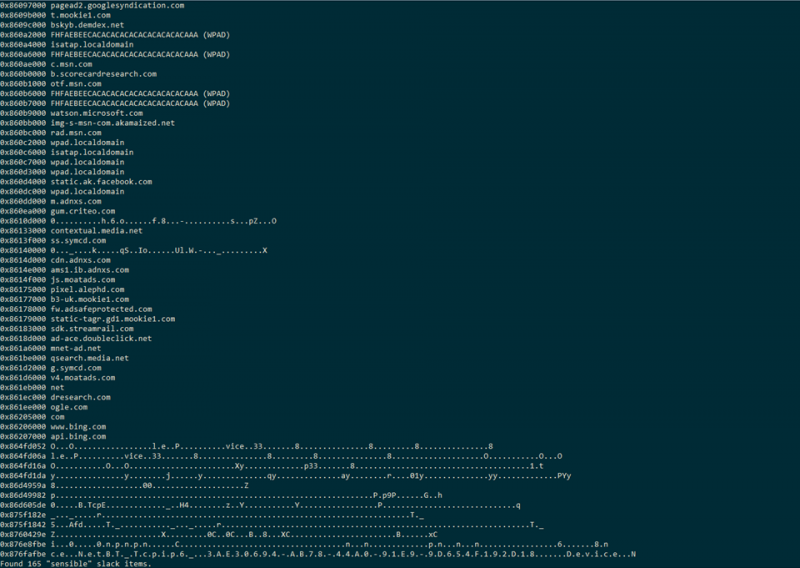
The packets are stored in a buffer and the locations are reused. So, sometimes there might be slack. The length of the Ethernet packet can be calculated and therefore the data after the packet, the slack, can also be read. A `slack` option was added to the plugin which extracts the slack only:

Conclusion
The eventual output from this process, the plugin, has an obvious place in your DFIR toolkit: it might just provide some useful information or intelligence pertinent to an Incident Response investigation. For me, I'm more aware of my (very human) biases, and I'm reminded of one of the reasons I love working at Context: I have smart people around me (like Steve) and we're encouraged to add to the community's knowledge - just like this.
And, I was delighted to be awarded a prize in the Volatility Plugin Contest 2015 which started this whole journey. The source code for the plugin is available on my personal GitHub and the community part of the Volatility Foundation's.
Erm, what about the DNS cache?
We don't talk about it. (But both Volatility and Rekal do.)
Contact and Follow-Up
Adam Bridge is part of our Response team in Context's Cheltenham office. Prior to Context, Adam has been a Lecturer in Computing and ICT, worked in the SOC of a large organisation, and supervised a Law Enforcement digital forensics team. He can often be found contributing to Volatility, posting to the X-Ways Forensics forum, learning Kung Fu, and trying not to fall off a mountain bike. See the Contact page for how to get in touch.